Tutorial - Day 2
Communicating Complex Data with Visualisation
Abstract:
Computational and statistical analytic methods alone may not solve the big data problems effectively, and their results could be rejected by users due to the lack of trust and interpretability. Interactive visualisation can explain, verify, and allow users to explore and see computed and original data in interpretable ways informing pattern recognition, insight, and relationship discovery. With so much information at your fingertips, it is a challenge to visualise complex and multidimensional data, highlight important messages, and remove the clutters that may cost audience an extra cognitive load.
This tutorial serves as a practical guide that provides theoretical knowledge and visualisation in exploratory and explanatory data analysis. The tutorial includes hands-on activities and practical demonstrations on how computational analytics can connect with visualisation on Tableau and Python platforms. Finally, we will showcase an interactive method to visualise complex charts, and flow charts on maps using the above platforms.
The topics of this two-hour tutorial are
-
Theoretical and knowledge
- Multi-dimensional data visualisation
- Visualisation for explanatory data analysis
- Geographics Data Visualisation
- Hands-on activities
-
Computational analytics and visualisation with Python and Tableau
- Real-time interactive visualisation with computational results
- Visualising complex charts and flow charts on maps
- Hands-on activities
Short Biographies:
Dr Nguyen is Associate Dean – Graduate Studies, Western Sydney University at the School of Computer, Data and Mathematical Sciences, and MARCS Institute for Brain, Behaviour and Development, Western Sydney University, and an Associate Professor in Visual Analytics. His main research areas are in the fields of Immersive Analytics, Visual Analytics and Information Visualisation, including Medical Data Analysis, Graph and Network Analysis, Graph Drawing, Applications with Visualisation and Visual Analytics, Visual Collaborative System, Human-Computer Interaction, and Machine Learning and interpretability. For his academic career, Dr Nguyen has authored and co-authored over 130 refereed publications. He has successfully supervised and co-supervised to the completion of eight PhD students, four Research Masters, and numerous Honours students and research project students.
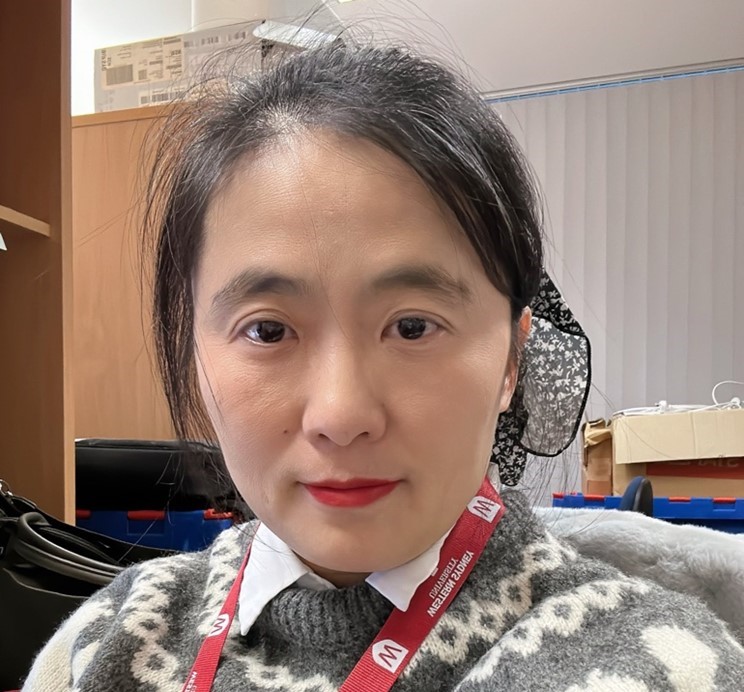
Dr Zhonglin (Jolin) Qu completed her PhD in 2024, and she currently is an associate lecturer in the School of Computer, Data & Mathematical Sciences at Western Sydney University. Dr Qu’s research focuses on visual analytics, explainable AI for visual decision-making, visualisation, data storytelling, virtual reality, and the metaverse. She has published 15 peer-reviewed papers in the past six years, seven of whom are the first author. Dr Qu has ten years of industry experience as a software engineer before becoming an academia. She has been teaching and coordinating various postgraduate and undergraduate subjects at Western Sydney University and University of Technology, Sydney including Visualisation, Visual Analytics, Systems Analysis and Design, Object Oriented Programming, and Artificial Intelligence.


